Carbon Footprint Labeling for Products: How to Calculate, Display, and Comply
Carbon footprint labeling is rapidly moving from a nice-to-have sustainability feature to a legal requirement for e-commerce merchants selling in the European Union. If you're selling batteries, textiles, electronics, or other regulated products in the EU, understanding how to calculate, verify, and display product carbon footprint data isn't optional anymore—it's compliance.
The EU's Ecodesign for Sustainable Products Regulation (ESPR) makes carbon footprint disclosure mandatory for Digital Product Passports (DPPs) across multiple product categories. But beyond compliance, merchants who get carbon labeling right are building consumer trust, differentiating their products, and preparing for a market that increasingly demands transparency.
This guide will walk you through everything you need to know: what a product carbon footprint actually is, how to calculate it (even as an SME), which EU standards apply, and how to display this data effectively to meet both regulatory requirements and customer expectations.
Why Carbon Footprint Labeling Is Becoming Mandatory
The EU's push for carbon footprint transparency stems from two interconnected goals: combating climate change and empowering consumers to make informed purchasing decisions.
The ESPR Framework
The Ecodesign for Sustainable Products Regulation (ESPR), which entered into force in July 2024, establishes the Digital Product Passport as a central tool for product transparency. Unlike voluntary carbon labeling initiatives of the past, ESPR makes specific environmental data—including carbon footprint—mandatory for products sold in the EU market.
For DPPs, carbon footprint data must be:
- Calculated using recognized methodologies (ISO 14067, PEF)
- Verified by third parties for certain high-risk product categories
- Accessible via QR code or other machine-readable formats
- Updated throughout the product lifecycle when relevant
Timeline and Enforcement
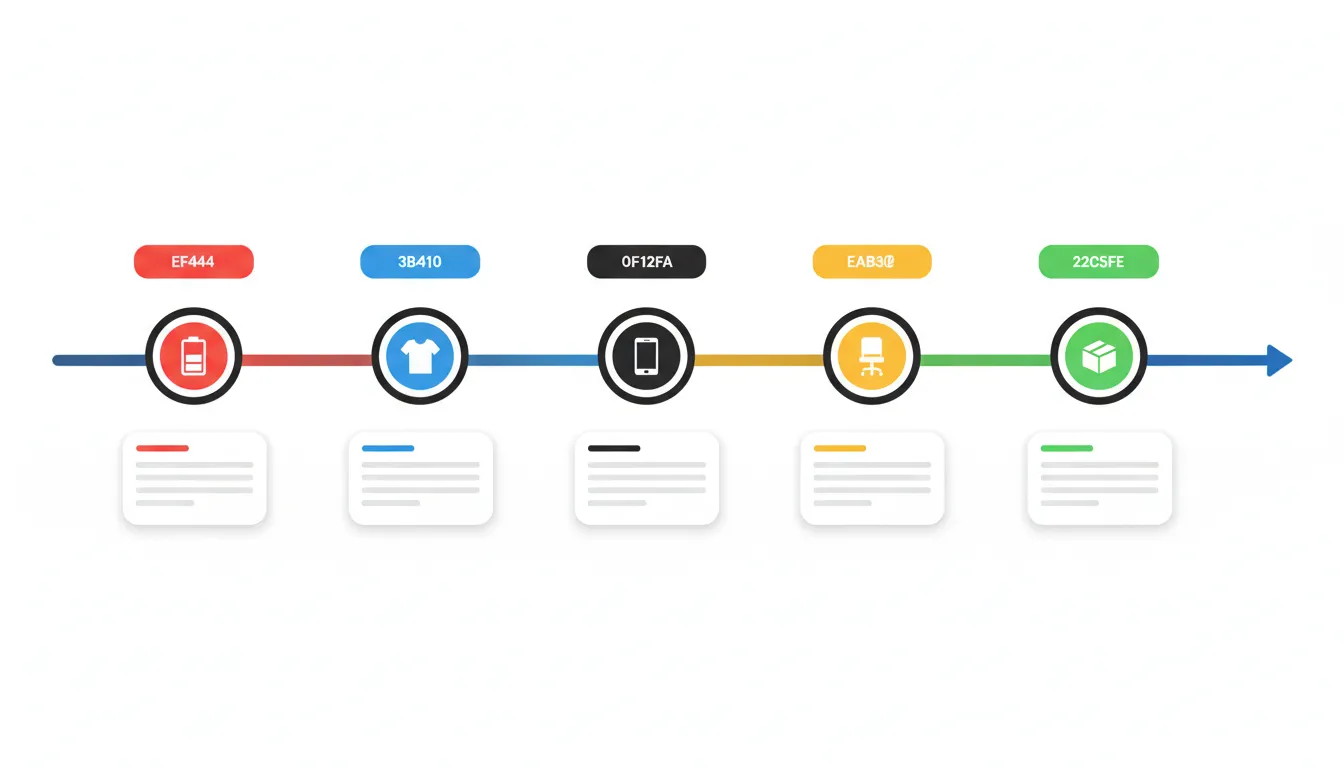
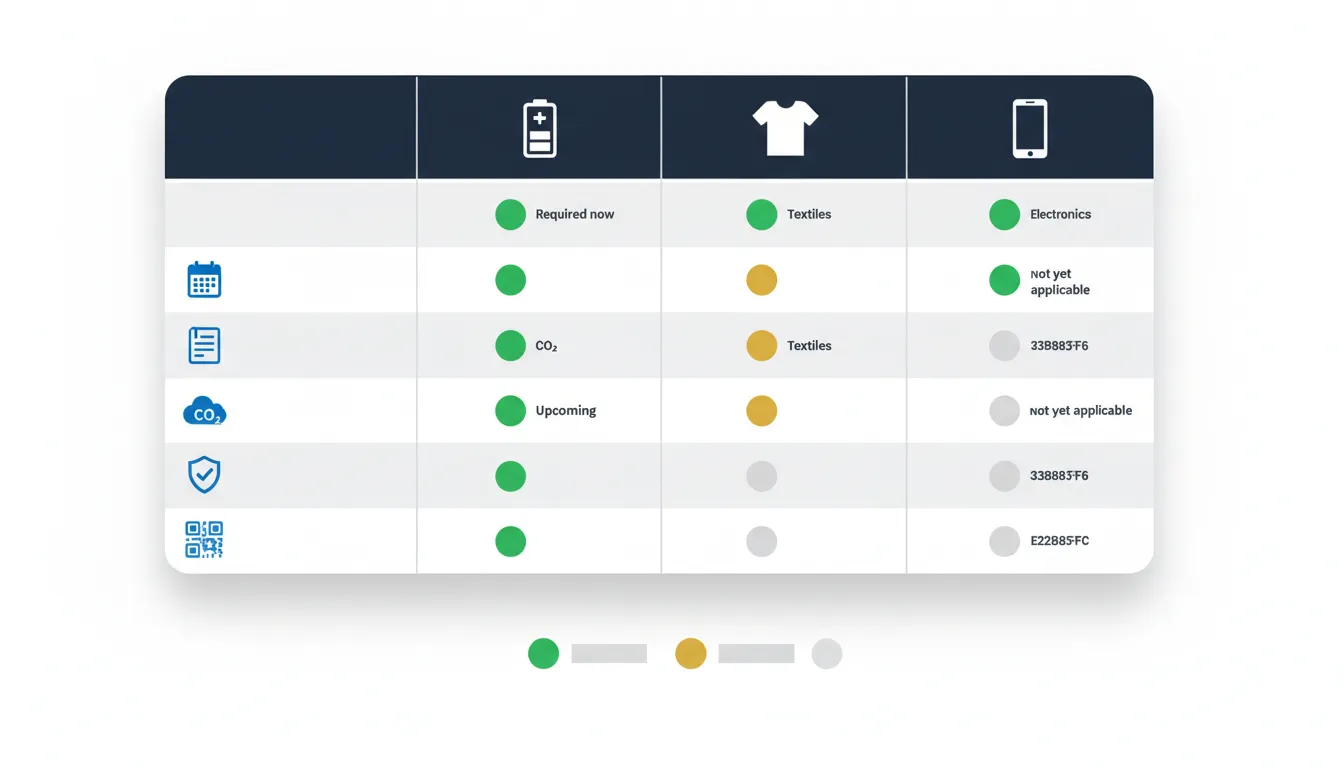
Product category delegated acts are being rolled out progressively:
- Batteries: Carbon footprint declaration mandatory from February 2025
- Textiles: Expected carbon footprint requirements in 2025-2026 delegated act
- Electronics: Energy labeling expansion to include carbon data (2026)
- Construction materials: Carbon intensity requirements under discussion
- Furniture and packaging: Timelines to be confirmed
Non-compliance risks product removal from EU marketplaces, fines, and reputational damage. Major retailers like Amazon, Zalando, and ASOS are already requiring suppliers to provide carbon footprint data ahead of legal deadlines.
What Is a Product Carbon Footprint?
A Product Carbon Footprint (PCF) is the total greenhouse gas (GHG) emissions produced throughout a product's lifecycle, expressed in kilograms or tonnes of CO2 equivalent (CO2e). The "equivalent" part is crucial—it accounts for all greenhouse gases (methane, nitrous oxide, etc.) by converting them into the equivalent warming impact of CO2.
Cradle-to-Gate vs. Cradle-to-Grave
There are two main scoping approaches:
Cradle-to-Gate measures emissions from raw material extraction through to the point where the finished product leaves the factory gate. This includes:
- Raw material extraction and processing
- Manufacturing and assembly
- Packaging production
- Transportation to distribution center
Cradle-to-Grave extends the scope to include:
- Distribution and retail
- Consumer use phase (especially relevant for electronics)
- End-of-life disposal, recycling, or waste management
For most ESPR-regulated products, cradle-to-grave is the expected scope, though specific delegated acts may allow cradle-to-gate for certain categories where use-phase emissions are negligible.
What Gets Counted
A comprehensive PCF includes all relevant GHG emissions:
- Scope 1: Direct emissions from owned or controlled sources (factory boilers, company vehicles)
- Scope 2: Indirect emissions from purchased electricity, heat, or cooling
- Scope 3: All other indirect emissions in the value chain (supplier emissions, transportation, use phase, end-of-life)
For product-level footprints, Scope 3 typically accounts for 70-90% of total emissions, making supply chain data collection the biggest challenge.
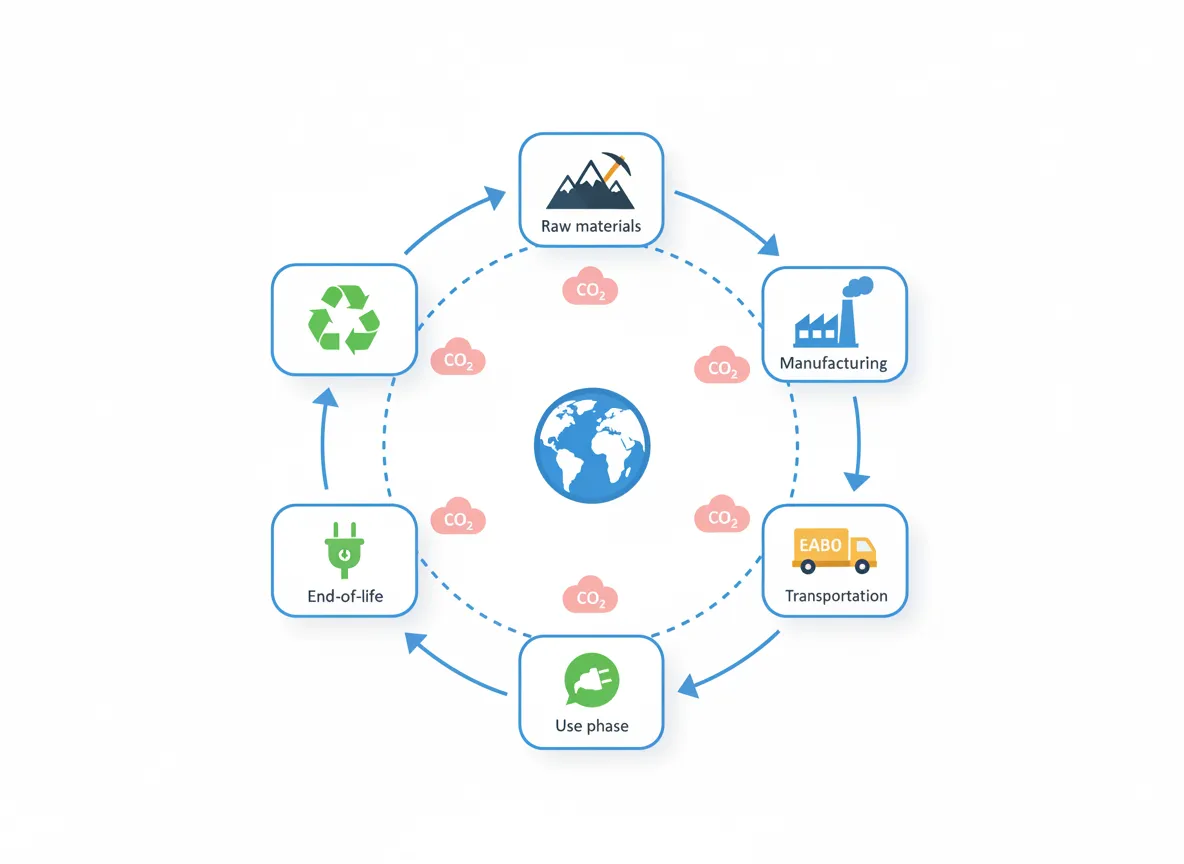
Life Cycle Assessment (LCA) Basics
The gold standard for calculating product carbon footprints is Life Cycle Assessment (LCA)—a comprehensive methodology standardized under ISO 14040 and ISO 14044. While full LCAs can be complex, understanding the four core stages helps you grasp what goes into your product's footprint.
Stage 1: Raw Materials and Extraction
This stage captures emissions from:
- Mining metals, drilling for oil, growing cotton or timber
- Processing raw materials into usable inputs (refining petroleum, spinning yarn, milling wood)
- Transportation of raw materials to manufacturers
Example: For a cotton t-shirt, this includes the emissions from growing cotton (fertilizers produce N2O), ginning, and spinning into yarn. Cotton cultivation alone can account for 30-40% of a garment's total footprint due to fertilizer use and irrigation energy.
Stage 2: Manufacturing and Assembly
Manufacturing emissions come from:
- Energy consumption in factories (electricity, natural gas, steam)
- Chemical processes (dyeing textiles, electroplating metals)
- Waste generated during production
- Packaging material production
Example: A smartphone's manufacturing stage includes semiconductor fabrication (extremely energy-intensive), assembly, and packaging. Semiconductor manufacturing can produce 10-20 kg CO2e per device.
Stage 3: Transportation and Distribution
Transportation emissions depend on:
- Distance traveled (sourcing from Asia vs. Europe)
- Mode of transport (air freight vs. ocean shipping vs. rail)
- Final mile delivery to consumers
Example: Shipping a 5 kg product from Shanghai to Hamburg by container ship generates approximately 0.15 kg CO2e (ocean freight is remarkably efficient per tonne-kilometer). Air freight would generate 20-30x more emissions for the same route.
Stage 4: Use Phase and End-of-Life
For some products, the use phase dominates:
- Electronics: Energy consumption during use (a laptop used for 4 years can generate 300+ kg CO2e just from electricity)
- Vehicles: Fuel consumption over lifetime
- Appliances: Operational energy
End-of-life includes:
- Collection and sorting
- Recycling or material recovery (which can offset emissions)
- Incineration or landfill disposal
Example: A high-efficiency dishwasher might have 200 kg CO2e embedded emissions from manufacturing but generate 800 kg CO2e from electricity consumption over 10 years—making the use phase 80% of total impact.
ISO 14067 and PEF Standards
The EU recognizes two primary methodologies for calculating product carbon footprints: ISO 14067 and the Product Environmental Footprint (PEF). Understanding which applies to your products is essential for compliance.
ISO 14067: Greenhouse Gases
ISO 14067:2018 provides principles, requirements, and guidelines for quantifying and communicating the carbon footprint of products. It's based on broader LCA standards (ISO 14040/14044) but focuses specifically on GHG emissions.
Key requirements:
- Define system boundaries (cradle-to-gate or cradle-to-grave)
- Use appropriate emission factors from recognized databases
- Include all relevant greenhouse gases (CO2, CH4, N2O, HFCs, etc.)
- Convert all emissions to CO2 equivalent using IPCC global warming potential factors
- Document data sources, assumptions, and allocation methods
ISO 14067 is globally recognized and accepted by most carbon footprint verification programs.
Product Environmental Footprint (PEF)
The EU's PEF methodology, established through Commission Recommendation 2013/179/EU and refined in subsequent guidance, goes beyond carbon to assess 16 environmental impact categories. However, climate change (carbon footprint) is typically the most significant category.
PEF features:
- Standardized Product Environmental Footprint Category Rules (PEFCRs) for specific product types (textile, electronics, batteries, etc.)
- More prescriptive than ISO 14067 about data quality requirements
- Requires specific databases (preferably EU-based like ecoinvent or ELCD)
- Five-year data validity rule for primary data
Which should you use? If a PEFCR exists for your product category and you're targeting EU compliance, prioritize PEF. Otherwise, ISO 14067 is broadly acceptable and often simpler for SMEs to implement.
How to Calculate Your Product's Carbon Footprint
For most SME merchants, conducting a full ISO-compliant LCA in-house isn't feasible. The good news: there are graduated approaches that balance accuracy, cost, and effort.
Option 1: Simplified Screening Assessment (DIY Friendly)
Best for: Initial estimates, low-risk products, small businesses
Approach: Use secondary data (industry averages) and online calculators to estimate your product's footprint.
Steps:
- Map your supply chain: List all major materials and their origins
- Assign emission factors: Use databases like ADEME Base Carbone (France), DEFRA conversion factors (UK), or EPA emission factors (US)
- Calculate by component: Multiply material quantities by emission factors
- Add transportation: Use distance-based calculators for freight
- Estimate manufacturing: Apply industry-average energy intensity data
- Sum and document: Total emissions and record all assumptions
Tools:
- Ecochain Mobius (€50-200/month): SME-focused LCA software with built-in databases
- Climatiq API: Emission factor database accessible via API for automated calculations
- Carbon Trust Footprint Calculator: Free online tool for basic product footprints
- ADEME Base Carbone: Free French emission factor database (23,000+ factors)
Limitations: Accuracy typically ±30-50%. Not sufficient for verified claims or high-scrutiny products, but acceptable for initial disclosure and internal decision-making.
Option 2: Hybrid Approach with Primary Data
Best for: Medium-sized businesses, products with dominant materials, preparing for verification
Approach: Collect primary data from key suppliers and use secondary data for minor components.
Steps:
- Conduct hotspot analysis: Identify which materials/processes contribute 70-80% of the footprint (usually 2-4 key components)
- Request supplier data: Ask major suppliers for carbon intensity of their products (kg CO2e per kg material or per unit)
- Use ISO 14067 templates: Provide suppliers with standardized data request forms
- Fill gaps with secondary data: Use emission factors for remaining components
- Calculate with LCA software: Tools like openLCA (free) or SimaPro (€5,000-10,000/year)
- Document rigorously: Maintain audit trail for verification
Supplier engagement tips:
- Start early—suppliers need time to gather or calculate data
- Offer to share results—suppliers may use this for their own reporting
- Consider supply chain collaboration platforms like Manufacture 2030 or Trellis that facilitate carbon data sharing
Expected accuracy: ±15-30% with good primary data coverage.
Option 3: Full Professional LCA
Best for: High-value products, verified claims, ESPR categories requiring third-party verification (batteries)
Approach: Hire a certified LCA practitioner or consultancy to conduct a comprehensive, ISO-compliant study.
When to hire a consultant:
- Your product is in a battery, electronics, or vehicle category requiring verification
- You need to defend carbon footprint claims in marketing (greenwashing risk)
- Your company has sustainability-linked finance tied to emissions reductions
- You're pursuing carbon labels (Carbon Trust Standard, Carbon Neutral certification)
What to expect:
- Cost: €3,000-15,000 per product SKU (varies by complexity)
- Timeline: 2-4 months for initial study
- Deliverables: ISO 14067-compliant report, critical review statement, communication materials
Finding consultants: Look for practitioners registered with ISO 14067 certification bodies or members of professional LCA organizations (SETAC, ACLCA in US, Upstream in Europe).
Working with Supply Chain Data
The biggest challenge in product carbon footprinting is obtaining reliable supplier data. Here's how to approach it:
Tier 1 suppliers (direct): Most sophisticated suppliers can provide:
- Cradle-to-gate carbon intensity (kg CO2e per kg of material)
- Energy mix used in production
- Transportation emissions to your facility
Tier 2+ suppliers (suppliers' suppliers): Rarely have direct data. Options:
- Ask Tier 1 to cascade requests
- Use industry-average data from databases
- Participate in sector initiatives (e.g., Higg Index for fashion, RMI for electronics)
Data quality hierarchy (from best to worst):
- Product-specific data from supplier's verified LCA
- Site-specific data (actual energy use at supplier's facility)
- Company-average data (average across all supplier facilities)
- Industry-average data from peer-reviewed databases
- Proxy data from similar materials/processes
Databases and Emission Factors
Key databases for product carbon footprinting:
ecoinvent (Switzerland)
- 20,000+ life cycle inventory datasets
- Gold standard for LCA, used in 80+ countries
- Subscription: €200-3,000/year depending on organization size
- Covers materials, energy, transport, waste processes
ADEME Base Carbone (France)
- 23,000+ emission factors, freely accessible
- Strong coverage of French/European supply chains
- Available in French and English
- No LCA software required—simple kg CO2e per unit values
GHG Protocol Product Standard Database
- Free tools and calculators
- Designed to align with ISO 14067
- Good for Scope 3 supply chain calculations
ELCD (European Life Cycle Database)
- Official EU reference database
- Mandatory for PEF studies
- Smaller than ecoinvent but high quality
Industry-specific databases:
- PEFCR databases: Specific to product categories with PEF Category Rules
- Higg Materials Sustainability Index: Textiles and apparel
- Environmental Product Declarations (EPDs): Construction materials, increasingly available for other sectors
ESPR Carbon Footprint Requirements by Product Category
The ESPR doesn't impose one-size-fits-all carbon labeling. Instead, product-specific delegated acts define exactly what data must be disclosed, how it's calculated, and verification requirements.
Batteries: Mandatory from February 2025
Under the EU Battery Regulation (2023/1542), which established the template for ESPR requirements, batteries above 2 kWh capacity must display:
Required data:
- Carbon footprint of battery manufacturing (cradle-to-gate)
- Breakdown by lifecycle stage (raw materials, cell production, assembly)
- Carbon footprint performance class (A-G scale based on kg CO2e/kWh)
Calculation methodology:
- Must follow Commission Delegated Regulation (EU) 2023/1542 Annex II
- Uses specific battery PEF Category Rules
- Requires third-party verification by notified body
Display requirements:
- QR code linking to Digital Battery Passport
- Performance class label visible on product or packaging
- Detailed data accessible electronically
Example: A 50 kWh electric vehicle battery with a footprint of 3,500 kg CO2e (70 kg CO2e/kWh) would display a "C" performance class based on EU benchmarks.
Textiles: Expected 2025-2026 Requirements
The textile delegated act is in late consultation stages. Expected requirements based on draft proposals:
Required data:
- Product carbon footprint (cradle-to-grave)
- Raw material sourcing emissions
- Manufacturing energy sources (renewable vs. fossil)
- Transportation distance and mode
- Care instructions carbon impact (washing, drying)
Calculation methodology:
- PEFCR for apparel and footwear (published 2018, update expected)
- Cut-off rules: must include processes contributing >1% of impact
- Use-phase must assume average washing cycles and energy mix per EU member state
Potential thresholds:
- Verification required for products claiming "low carbon"
- Self-declaration allowed for basic compliance disclosure
- Digital passport must include improvement potential (how to reduce footprint through care)
Example: A cotton t-shirt sold in Germany might show: "Carbon footprint: 8.2 kg CO2e (2.1 kg materials, 3.8 kg manufacturing, 0.3 kg transport, 2.0 kg use-phase based on 50 washes)."
Electronics: Energy + Carbon Labeling Expansion
Electronics face a dual challenge: existing energy labels (A-G scale) plus new carbon footprint requirements rolling out 2026-2027.
Expected requirements:
- Total product carbon footprint (manufacturing + use-phase)
- Use-phase calculated based on TEC (Typical Energy Consumption) over expected product life
- End-of-life recycling rates and associated avoided emissions
- Critical raw material content and associated extraction emissions
Product categories in scope:
- Smartphones and tablets
- Laptops and desktop computers
- Displays and monitors
- Servers and data storage
- Consumer electronics (TVs, game consoles)
Calculation challenges:
- Semiconductor manufacturing emissions data often proprietary
- Use-phase depends on consumer behavior assumptions
- Rapid technological obsolescence complicates lifecycle estimates
Example: A laptop might display: "Embodied carbon: 250 kg CO2e | Use-phase (4 years): 180 kg CO2e | Total: 430 kg CO2e | Recycling potential: -30 kg CO2e."
Other Product Categories
Construction materials: Carbon intensity requirements already exist in some EU green building standards (LEED, BREEAM). ESPR likely to standardize EPD disclosure requirements.
Furniture: Expected focus on sustainable forestry, wood sourcing emissions, and longevity/repairability to extend use-phase.
Packaging: Already covered under Packaging and Packaging Waste Regulation revisions, which will require recycled content and carbon intensity data.
Cosmetics and personal care: Under discussion, likely to focus on palm oil and ingredient sourcing emissions.
How to Display Carbon Footprint Data Effectively
Getting the calculation right is only half the battle. How you present carbon footprint data determines whether it builds trust or causes confusion.
On-Product and Packaging Display
QR Code placement:
- Visibility: Must be easily locatable without removing packaging
- Size: Minimum 2x2 cm for reliable smartphone scanning
- Contrast: High contrast background (light code on dark or vice versa)
- Above requirement: Include "Digital Product Passport" text label next to QR
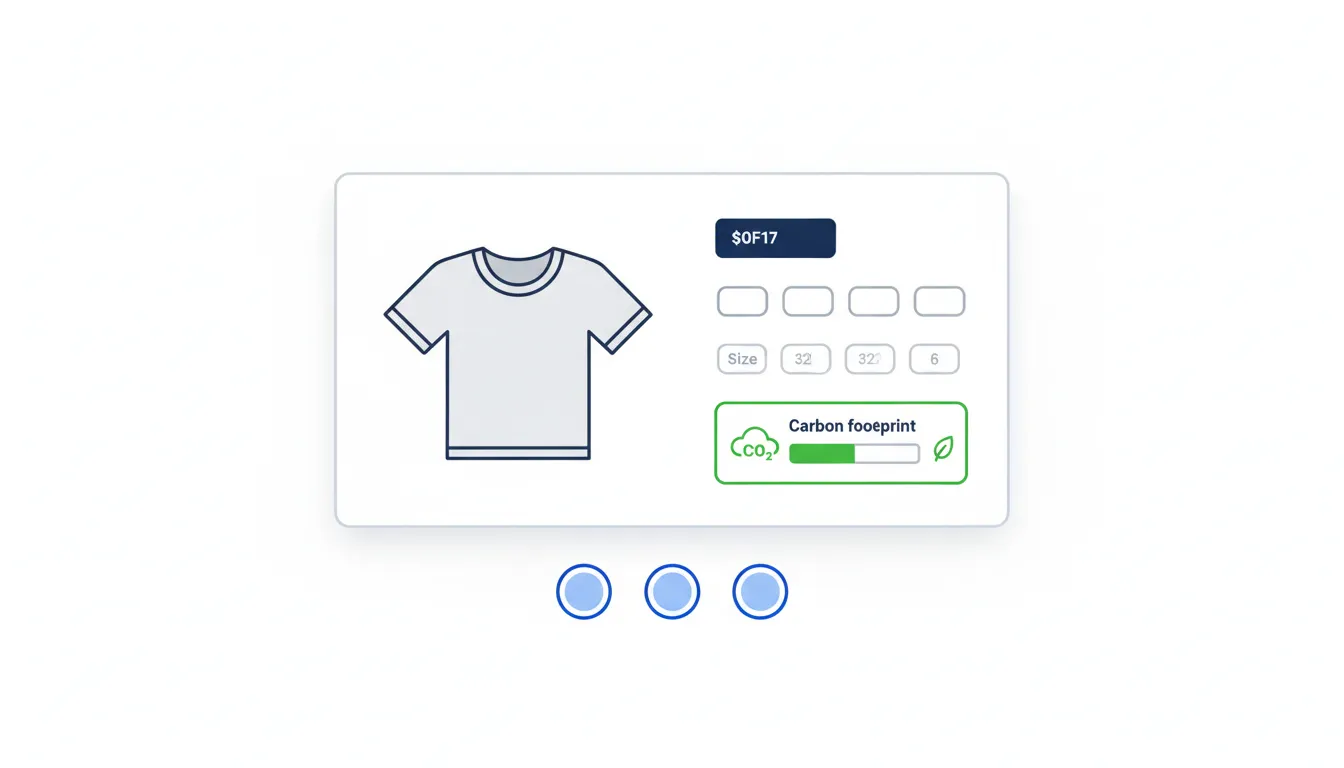
Optional on-pack label: While not always required, a visual carbon footprint badge improves transparency:
- Display total footprint: "8.2 kg CO2e"
- Comparison reference: "Equivalent to driving 50 km" or "Industry average: 12.5 kg"
- Certification logo: If verified by third party (Carbon Trust, ClimatePartner, etc.)
Physical space constraints: For small products, QR code alone may suffice with all data accessible digitally.
Digital Product Page Display
E-commerce merchants should display carbon footprint prominently on product pages:
Placement best practices:
- Near product specifications (size, weight, materials)
- Expandable accordion or tab labeled "Sustainability"
- Visible without scrolling for high-environmental-concern categories (outdoor gear, eco-fashion)
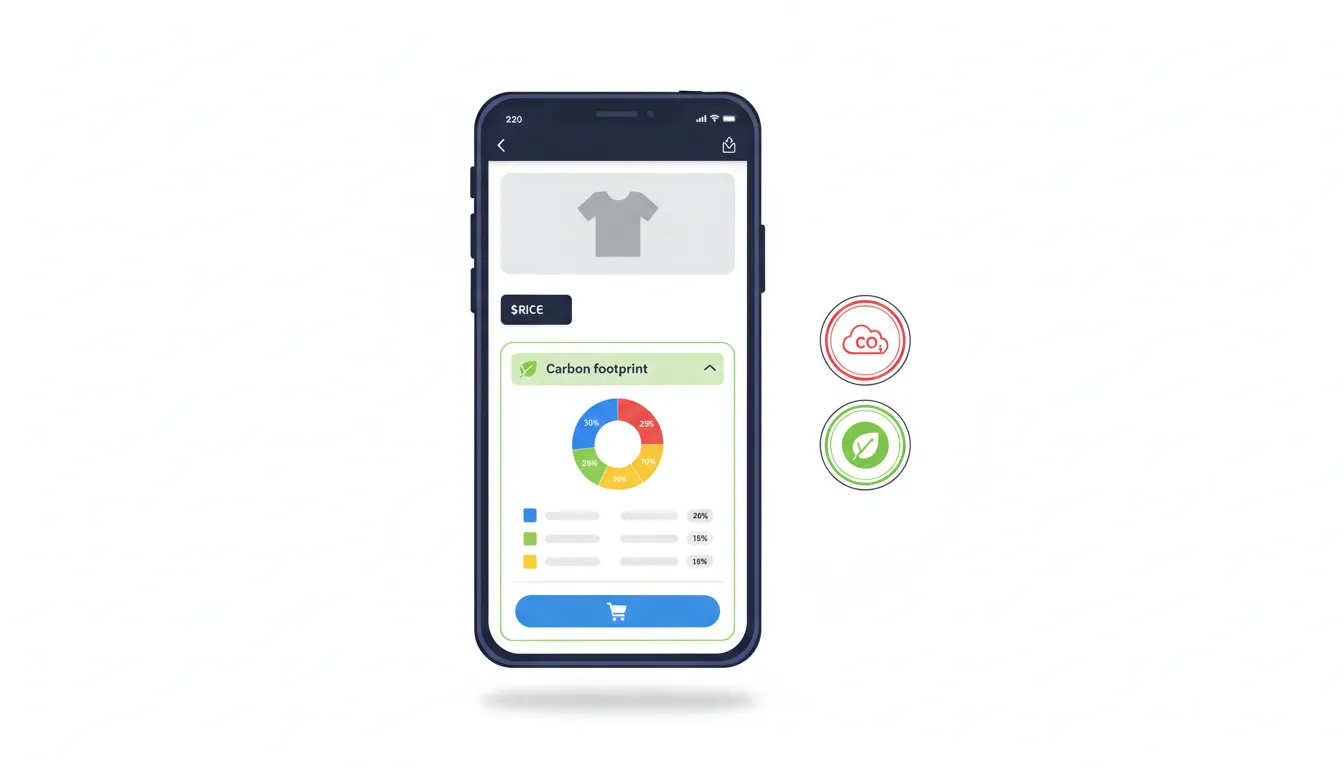
Information hierarchy:
- Headline number: "12.5 kg CO2e total carbon footprint"
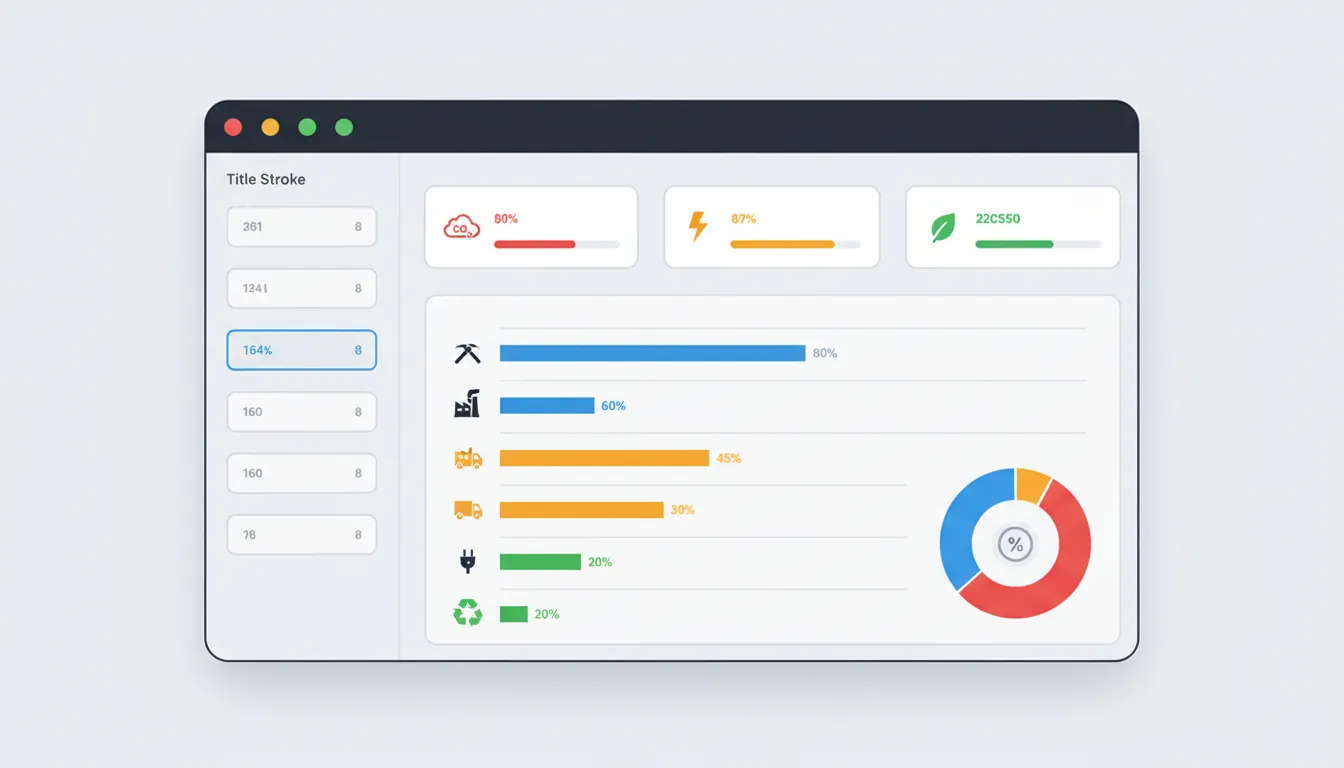
- Lifecycle breakdown: Visual chart showing % by stage
- Context: Equivalent activities (km driven, trees needed to offset)
- Use-phase tips: "Reduce footprint by 30% by air-drying instead of tumble drying"
- Verification status: "Calculated using ISO 14067 | Verified by [organization]"
- Last updated: "Data as of January 2025"
Interactive elements:
- Comparison slider: "This product vs. similar items"
- Calculator: "Your personal impact based on use frequency"
- "Learn more" link to detailed LCA report or methodology page
In the Digital Product Passport
Your DPP must present carbon footprint data in a structured, machine-readable format while remaining human-friendly:
Required data fields (based on draft ESPR implementing acts):
{
  "carbonFootprint": {
    "totalEmissions": 8.2,
    "unit": "kgCO2e",
    "scope": "cradle-to-grave",
    "methodology": "ISO 14067:2018",
    "referenceYear": 2024,
    "verificationStatus": "self-declared",
    "lifecycleBreakdown": {
      "rawMaterials": 2.1,
      "manufacturing": 3.8,
      "transportation": 0.3,
      "usePhase": 2.0,
      "endOfLife": 0.0
    },
    "dataQuality": "hybrid-primary-secondary",
    "lastUpdated": "2025-01-15"
  }
}
Human-readable presentation:
- Executive summary in plain language
- Visual representations (pie charts, bar graphs)
- Downloadable PDF report for B2B customers
- Permalink for consistent referencing
Design and User Experience
Visual design principles:
- Use green sparingly (only for verified low-carbon claims to avoid greenwashing perception)
- Carbon neutral or negative: Blue/green badges acceptable with offset transparency
- High footprint: Neutral presentation (gray/blue) with improvement context
- Icons: CO2 cloud, leaf, planet symbols (use consistently across products)
Accessibility:
- WCAG 2.1 AA compliant (sufficient color contrast)
- Screen-reader compatible data tables
- Multi-language support for EU markets (minimum English + local language)
Mobile optimization:
- Responsive QR code scanner integration
- Touch-friendly expandable sections
- Lightweight page load (sustainability data shouldn't ironically add significant server emissions)
Consumer Perception and Market Impact
Carbon footprint labeling isn't just compliance—it's a competitive differentiator in markets where sustainability drives purchasing decisions.
The Data: Do Consumers Care?
Recent studies show significant consumer interest in carbon labeling:
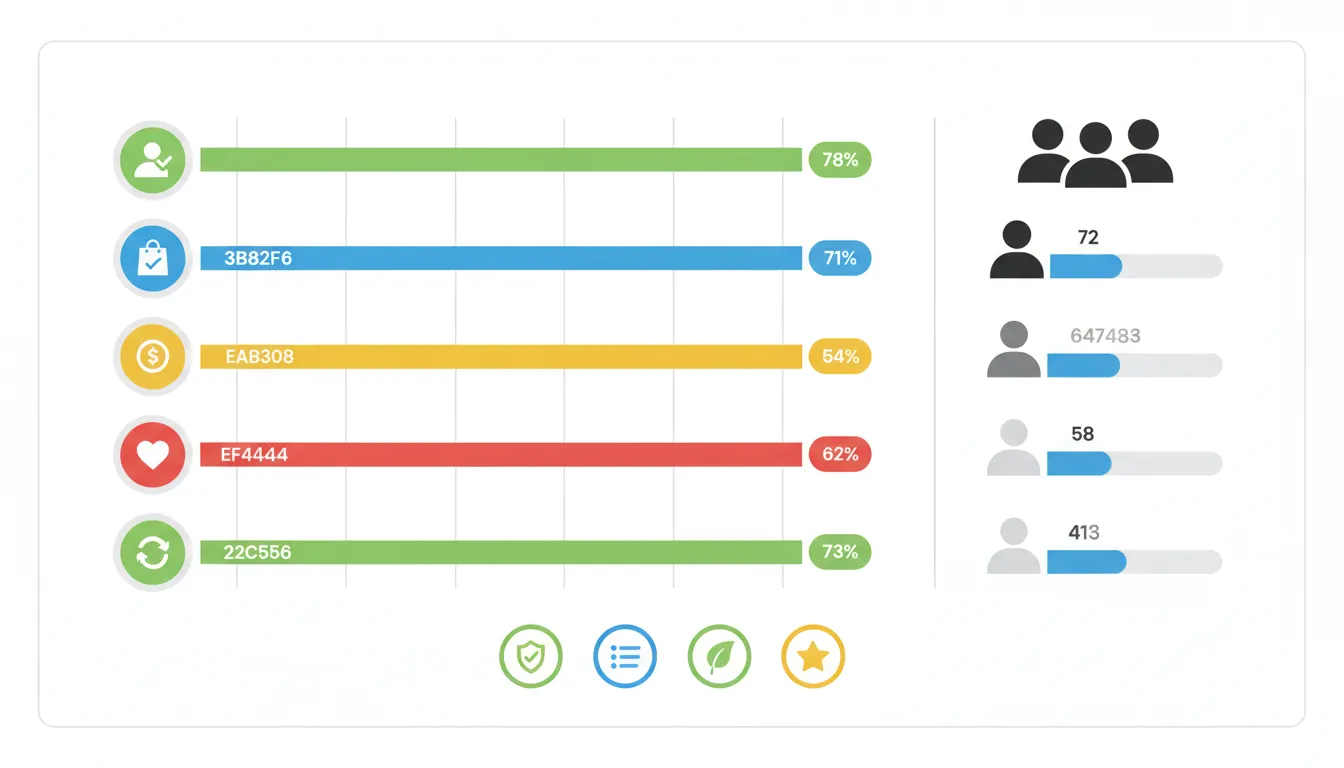
European Consumer Survey (2023):
- 72% of EU consumers want to know the carbon footprint of products they buy
- 58% willing to pay 5-10% premium for lower-carbon alternatives
- 43% have switched brands based on environmental information in past year
But trust is fragile:
- 65% skeptical of environmental claims without third-party verification
- 81% want standardized labels (not brand-specific eco-badges)
- Only 34% currently understand what "kg CO2e" means (education needed)
Market Leaders Setting Examples
Allbirds (footwear): Pioneered product-level carbon labeling in fashion, displaying footprint on every product since 2020. Consumer research shows 40% purchase consideration lift among sustainability-conscious shoppers.
Oatly (food): Large carbon footprint labels on packaging comparing to dairy alternatives. Transparency about methodology builds trust even when footprints are higher than competitors for some products.
H&M (apparel): Rolled out sustainability scorecards including carbon footprint for products on website. Part of broader Fashion Transparency Index leadership.
Apple (electronics): Product Environmental Reports published for all devices since 2009, now including headline carbon footprint on product pages. iPhone 15 promoted as "first carbon-neutral phone" (though offsets controversial).
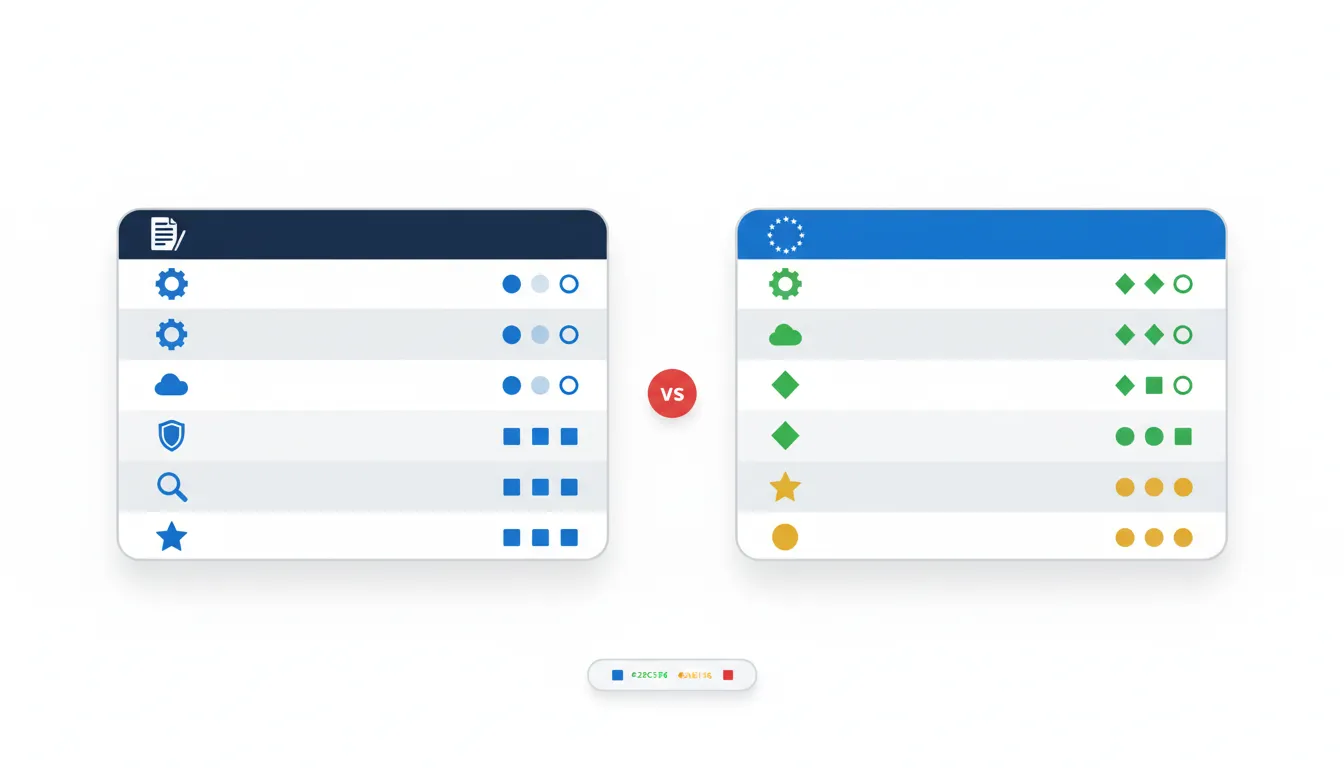
The Comparison Effect
Carbon labels are most effective when they enable comparisons:
- Within-category: "This shirt: 8 kg CO2e | Category average: 12 kg" (37% lower)
- Over time: "2024 version: 8 kg | 2023 version: 11 kg" (improvement narrative)
- Alternative choices: Cotton vs. polyester, organic vs. conventional
Caution: Comparison claims require robust methodology consistency. EU Unfair Commercial Practices Directive prohibits misleading environmental comparisons.
Behavioral Nudges That Work
Research on carbon label effectiveness shows:
- Color coding (traffic light: green/yellow/red) increases impact on purchase decisions by 23% vs. numbers alone
- Absolute numbers + context ("8 kg CO2e = driving 50 km") improves comprehension by 40%
- Improvement framing ("30% lower than 2022") more effective than absolute values for high-footprint products
- Use-phase tips increase engagement and brand perception (shows you care beyond compliance)
Common Pitfalls and How to Avoid Them
Carbon footprint labeling is still evolving, and even well-intentioned merchants make mistakes that undermine credibility or trigger regulatory scrutiny.
Pitfall 1: "Carbon Neutral" Without Offset Transparency
The mistake: Displaying "Carbon Neutral Product" without disclosure of how neutrality is achieved (offsets, reductions, renewable energy claims).
Why it's problematic:
- EU Green Claims Directive (expected 2024-2025) will ban "carbon neutral" claims unless substantiated with transparent offset details
- Consumer trust collapses when offset projects are low-quality (e.g., avoided deforestation that wasn't at risk)
- Offsets don't reduce actual product footprint—it's compensatory, not preventative
How to fix it:
- If using offsets, disclose: "8 kg CO2e footprint | Offset through [project name] verified by [Gold Standard/Verra]"
- Link to offset project details (location, type, certification)
- Prioritize footprint reduction over offsetting in your roadmap
- Use terminology: "Climate contribution" or "Offset-supported" rather than "neutral"
Pitfall 2: Cherry-Picking System Boundaries
The mistake: Calculating cradle-to-gate but displaying as if it's cradle-to-grave, or excluding high-impact stages.
Why it's problematic:
- Violates ISO 14067 completeness requirements
- Creates false comparisons (competitor includes use-phase, you don't)
- Regulatory audits will identify boundary exclusions
How to fix it:
- Clearly state system boundary: "Manufacturing footprint (cradle-to-gate): 8 kg CO2e | Use-phase not included"
- If use-phase is significant (electronics, appliances), include it or don't make carbon claims
- Document exclusions and justify (e.g., "End-of-life not included due to variable recycling rates")
Pitfall 3: Outdated or Unverified Data
The mistake: Calculating footprint once in 2020, never updating despite supply chain changes, or using low-quality emission factors.
Why it's problematic:
- ESPR requires regular updates (typically annually or when significant process changes occur)
- Supplier energy mixes change (renewable adoption reduces footprints over time)
- Auditors will check data recency during verification
How to fix it:
- Set annual review cycles for carbon footprint data
- Track supplier changes and request updated data
- Use most recent emission factor databases (IPCC updates global warming potentials periodically)
- Display "Last updated: [date]" on all carbon labels and DPPs
Pitfall 4: Vague Methodology Disclosure
The mistake: "Calculated using industry-standard methods" without specifying ISO 14067, PEF, or data sources.
Why it's problematic:
- Prevents verification and comparison
- Suggests data may not withstand scrutiny
- ESPR requires methodology transparency
How to fix it:
- Always specify: "Calculated according to ISO 14067:2018"
- List primary data sources: "Supplier data from 60% of supply chain by mass, remaining 40% from ecoinvent v3.9"
- Provide link to detailed methodology document in DPP
- If simplified approach used, state limitations: "Screening-level assessment, ±30% uncertainty"
Pitfall 5: Ignoring Uncertainty and Variability
The mistake: Displaying "8.234 kg CO2e" implying false precision when data has ±40% uncertainty.
Why it's problematic:
- Overstates confidence in calculations
- Misleads consumers about accuracy
- Scientifically inappropriate given data quality
How to fix it:
- Round to appropriate significant figures (usually 2): "8.2 kg CO2e"
- For high-uncertainty data, provide range: "8-12 kg CO2e"
- Disclose data quality tier (primary vs. secondary data coverage)
- Include uncertainty statement in technical documentation
Pitfall 6: Forgetting Regional Variations
The mistake: Using single carbon footprint value for products sold globally when electricity grids vary dramatically.
Why it's problematic:
- A laptop's use-phase footprint in Poland (coal-heavy grid) is 3-4x higher than in Norway (hydropower)
- Misleads consumers about actual impact
- Misses opportunity to encourage low-carbon usage
How to fix it:
- Calculate use-phase by region/country where data allows
- Display: "Use-phase: 180 kg CO2e (EU average grid) | varies by location"
- Provide calculator: "Enter your country to see your personal impact"
- Or use conservative approach: calculate based on high-carbon grids and note "Your actual impact may be lower with renewable energy"
How PassportPro Enables Carbon Footprint Labeling
PassportPro streamlines carbon footprint disclosure by integrating it directly into your Digital Product Passport workflow—no need for separate tools or manual updates.
Flexible Data Input
Multiple ways to add carbon footprint data:
- Manual entry: Simple form fields for total footprint and lifecycle breakdown
- CSV import: Bulk upload carbon data for entire catalog
- API integration: Connect LCA software (openLCA, SimaPro, Ecochain) to auto-sync footprint calculations
- Supplier portal: Share links for suppliers to submit component-level data directly
Data structure supports:
- Total product footprint (kg CO2e)
- Lifecycle stage breakdown (raw materials, manufacturing, transport, use, end-of-life)
- Methodology specification (ISO 14067, PEF, other)
- Data quality indicators (primary vs. secondary data coverage)
- Verification status and certifier details
- Last updated timestamp with version history
Dynamic Display Options
Customizable product page widgets:
- Compact badge: "8.2 kg CO2e" with info icon
- Expanded card: Full lifecycle breakdown with visual chart
- Comparison mode: Show vs. category average or previous versions
- Calculator: Use-phase impact based on customer inputs
All displays link to full DPP via QR code or direct link, ensuring compliance with ESPR accessibility requirements.
ESPR Compliance Built-In
PassportPro's DPP structure is designed around ESPR data requirements:
- Machine-readable JSON-LD format with schema.org compatibility
- Human-readable web interface in multiple EU languages
- Mandatory field validation (alerts you if carbon footprint data missing for regulated product categories)
- Audit trail for data updates (who changed what and when)
Product category templates pre-configure required fields:
- Batteries: Manufacturing footprint, performance class, notified body verification number
- Textiles: Cradle-to-grave with use-phase washing assumptions disclosed
- Electronics: Embodied + use-phase based on TEC standard
Version Control and Updates
Products' carbon footprints change as supply chains evolve. PassportPro handles this:
- Version history: Archive previous footprint data with timestamps
- Update scheduling: Set reminders to refresh data annually
- Change highlighting: Automatically show improvements or increases vs. previous versions
- Bulk updates: When a supplier updates their carbon intensity, update all affected products at once
Third-Party Verification Integration
For products requiring verified carbon footprints:
- Upload verification certificates (PDF) linked to specific products
- Display verification badge with certifier logo (Carbon Trust, ClimatePartner, TÜV, etc.)
- Expiration date tracking with alerts when reverification needed
- Verifier contact details for auditor access
Consumer Trust Features
Transparency by default:
- "How we calculate" methodology page automatically generated from your settings
- Assumption disclosure: energy grids used, transportation distances, use-phase scenarios
- Data source transparency: % primary vs. secondary data
- Improvement roadmap: Optional field to share reduction targets ("Target: 20% reduction by 2026")
Engagement tools:
- "Reduce your impact" tips based on product category (e.g., wash in cold water, use eco-mode)
- Impact comparison: Equivalent activities (km driven, trees needed)
- Social sharing: "I chose a low-carbon option" with product link
Practical Steps: Getting Started Today
Implementing carbon footprint labeling doesn't have to be overwhelming. Here's a phased approach that balances compliance timelines, resource constraints, and credibility.
Phase 1: Assessment and Prioritization (Week 1-2)
Step 1: Determine regulatory urgency
- Audit your catalog: which products fall under ESPR regulations?
- Batteries: immediate priority (Feb 2025 deadline)
- Textiles/electronics: medium priority (2025-2026)
- Other categories: monitor regulatory developments
Step 2: Identify high-impact products
- Start with: best-sellers, high-margin products, or items customers ask about sustainability
- Or: products with likely low footprints that can differentiate you
Step 3: Assess current data availability
- Do you have Bills of Materials (BOMs) with supplier details?
- Have any suppliers provided environmental data previously?
- Do you have energy consumption data for manufacturing (if you make products)?
Phase 2: Initial Calculation (Week 3-6)
For most SMEs, start with simplified screening approach:
Step 1: Map product lifecycle
- List all materials and components by weight/volume
- Identify manufacturing processes
- Document transportation routes (origin to warehouse)
Step 2: Apply emission factors
- Use free databases: ADEME Base Carbone, DEFRA factors
- Quick example for cotton t-shirt:
- Cotton fabric: 0.4 kg × 15 kg CO2e/kg = 6.0 kg
- Polyester trim: 0.05 kg × 7 kg CO2e/kg = 0.35 kg
- Manufacturing (textile): ~1.5 kg CO2e per garment (industry avg)
- Sea freight (Asia-EU): 8,000 km × 0.5 kg × 0.011 kg CO2e/tonne-km = 0.044 kg
- Total: ~7.9 kg CO2e (rounds to 8 kg)
Step 3: Document assumptions
- Keep a simple spreadsheet: material, quantity, emission factor source, calculation
- This becomes your "methodology" documentation
Step 4: Sense-check
- Compare to academic studies or EPDs for similar products
- If your t-shirt shows 50 kg CO2e, something's wrong (typical range: 5-15 kg)
Phase 3: Supplier Engagement (Ongoing)
Step 1: Prioritize suppliers by impact
- Focus on suppliers of materials contributing 70%+ of footprint
- For a laptop: semiconductor manufacturer matters more than box supplier
Step 2: Create simple data request
- Template: "We need the carbon intensity (kg CO2e per kg material or per unit) for [product] from your facility. This is for EU regulatory compliance. Can you provide this, or share any LCA studies you've completed?"
Step 3: Offer support
- Many suppliers, especially SMEs, may not have data
- Offer to share calculation guidance or connect them with industry initiatives
- Consider collaborative approach: "Let's calculate together using your energy bills"
Step 4: Set expectations
- Make supplier environmental data a requirement in future contracts
- Give 6-12 months' notice for compliance
- Consider sustainability a factor in supplier selection going forward
Phase 4: Display and Communication (Week 7-8)
Step 1: Activate PassportPro carbon footprint features
- Input calculated data for initial products
- Choose display options (compact badge vs. full breakdown)
- Customize "how we calculate" methodology page
Step 2: Add to product pages
- Start with sustainability-focused products
- Include context: comparisons, equivalents, use-phase tips
- Link to full Digital Product Passport
Step 3: Generate QR codes
- PassportPro automatically creates unique QR codes per product
- Download and add to packaging designs (start with new print runs)
- For existing inventory, consider QR stickers or packaging inserts
Step 4: Train customer service team
- Prepare FAQs about carbon footprint data
- Ensure team can explain methodology and limitations
- Empower them to direct customers to detailed DPP information
Phase 5: Verification and Improvement (Ongoing)
Step 1: Decide verification needs
- Batteries and high-risk products: third-party verification required
- Marketing claims ("low carbon," "carbon reduced"): verification recommended
- Basic compliance disclosure: self-declaration acceptable initially
Step 2: Engage verifier if needed
- Get quotes from 2-3 certification bodies (Carbon Trust, ClimatePartner, TÜV, SCS Global)
- Expect 6-12 weeks for verification process
- Budget €3,000-€10,000 per product family
Step 3: Set improvement targets
- Identify hotspots: which lifecycle stage offers biggest reduction opportunity?
- Common wins: renewable energy for manufacturing, regional sourcing to reduce transport, material substitution
- Track annually and communicate progress
Step 4: Expand coverage
- Once process is established, roll out to additional products
- Aim for 100% catalog coverage for regulated categories by legal deadlines
- Consider full catalog labeling for competitive advantage
Timeline Summary
Immediate (if selling batteries): Complete screening assessment and display preliminary data by Feb 2025, engage verification partner.
3-6 months (textiles/electronics): Complete hybrid approach with some primary supplier data, prepare for delegated act publication.
12 months (all merchants): Establish systematic carbon data collection, supplier engagement protocols, and annual update cycles.
Conclusion: Carbon Transparency as Competitive Advantage
Carbon footprint labeling is transitioning from a progressive sustainability practice to a legal requirement across the EU. But merchants who view this as merely a compliance checkbox are missing the strategic opportunity.
The reality: Consumers increasingly choose brands that provide transparency, even when the footprint isn't perfect. A forthcoming study from Cambridge University found that displaying carbon footprint data—even for high-carbon products—increased brand trust scores by 28% compared to providing no information at all. Honesty and commitment to improvement matter more than having the lowest footprint today.
The competitive edge: Early adopters of carbon labeling are capturing market share in the rapidly growing sustainable e-commerce segment (projected 18% CAGR through 2028). They're also building relationships with retailers like Zalando and ASOS that increasingly require environmental data from suppliers as a condition of listing.
The infrastructure benefit: Building carbon footprint calculation and disclosure capabilities now creates reusable infrastructure. The same supply chain data, LCA processes, and DPP systems required for carbon footprints enable compliance with other ESPR requirements: recycled content disclosure, repairability scoring, chemical composition, and more.
Getting started is easier than you think: You don't need a full ISO-compliant LCA for every SKU on day one. Start with simplified screening assessments for priority products, display that data transparently with appropriate caveats, and commit to improving data quality over time. Consumers and regulators both respect a clear improvement trajectory.
PassportPro makes this practical by integrating carbon footprint data collection, calculation support, and display directly into your Digital Product Passport workflow. Whether you're preparing for battery regulation deadlines, getting ahead of textile requirements, or simply differentiating your brand through transparency, the tools to communicate carbon footprint data effectively are available now.
The question isn't whether carbon footprint labeling is coming to your product category—it's whether you'll be ready to use it as a compliance requirement or a competitive advantage. Companies that choose the latter are building the sustainable brands of tomorrow.
Ready to add carbon footprint data to your Digital Product Passports? PassportPro provides the tools to calculate, verify, and display product carbon footprints in compliance with ESPR requirements. Start your free trial and create your first carbon-labeled DPP in minutes.
Resources:
Ready to get started?
Create EU-compliant Digital Product Passports for your Shopify store in minutes.
Install PassportPro on Shopify